
Graphics are an essential ingredient for sticky learning.They transform dull, text-heavy content into memorable, easy-to-understand concepts.That's why we serve fresh, thought-provoking and relevant visuals that bring content to life.Want your learners to lean in? We mix in eye-catching illustrations, visual metaphors and clever infographics – to make them go 'hmmm'…
A picture is worth a thousand words. Really.Hungry Minds visuals will take your learning from 'meh' to 'aha!'Break down complex informationSometimes, a process or concept can seem overwhelming when it's just a wall of text. But – turn that same information into a beautifully-designed flowchart or infographic, and it becomes manageable, understandable, and even enjoyable to learn.Make learning engaging and interactiveNo more boring, static learning content. With the power of graphic design, we can create eLearning modules that are not only visually stunning, but also highly interactive. Think clickable diagrams, animated infographics, and immersive visual scenarios.Provide on-the-job supportLearning doesn't stop when a program ends. That's why we design practical, visually appealing job aids and quick reference guides that learners can use on the job. These tools help reinforce key concepts and help learning to stick.
Graphics and infographics in action.

FAQS
At Hungry Minds, we don't bolt graphics onto learning as an afterthought—we integrate them from day one as essential learning tools. We identify the specific concepts that benefit most from visual representation and craft them to align precisely with your learning objectives.
While others treat graphics as decoration, we see them as cognitive tools that transform how information is processed and remembered. Our difference is simple: we're learning experts first, visual communicators second. Every graphic choice we make is driven by solid learning science, not just aesthetic preferences.
We've seen it all—decoration over function (slapping in stock photos that look nice but add zero learning value), visual overload (cramming every available space with graphics until learners can't tell what's important), and inconsistency (mixing styles that confuse rather than clarify).
Matching graphics to learning objectives isn't guesswork—it's where our science meets your specific needs. For knowledge-building, we use clear representational graphics. For process learning, we craft sequential visuals. For attitude change, we lean into emotional and transformational imagery.
Inclusive visual learning isn't optional—it's essential. We incorporate alternative text descriptions for all meaningful graphics, ensure sufficient contrast ratios, and create graphics that work without colour alone as the only differentiator.
Graphics are visual elements that communicate information through images, icons, and visual design. Infographics take this a step further – they're visual storytellers that combine graphics, data, and text into a cohesive narrative that makes complex information immediately accessible.
Good graphic design isn't just about making things pretty – it's about making learning stick. Well-designed materials reduce cognitive load, highlight key information, create visual hierarchy, and trigger emotional connections that make information memorable.
Graphics in education aren't just pretty pictures—they're learning accelerators. They capture attention, simplify complexity, bridge language barriers, and make abstract concepts concrete. Good graphics reduce the mental gymnastics needed to process information.
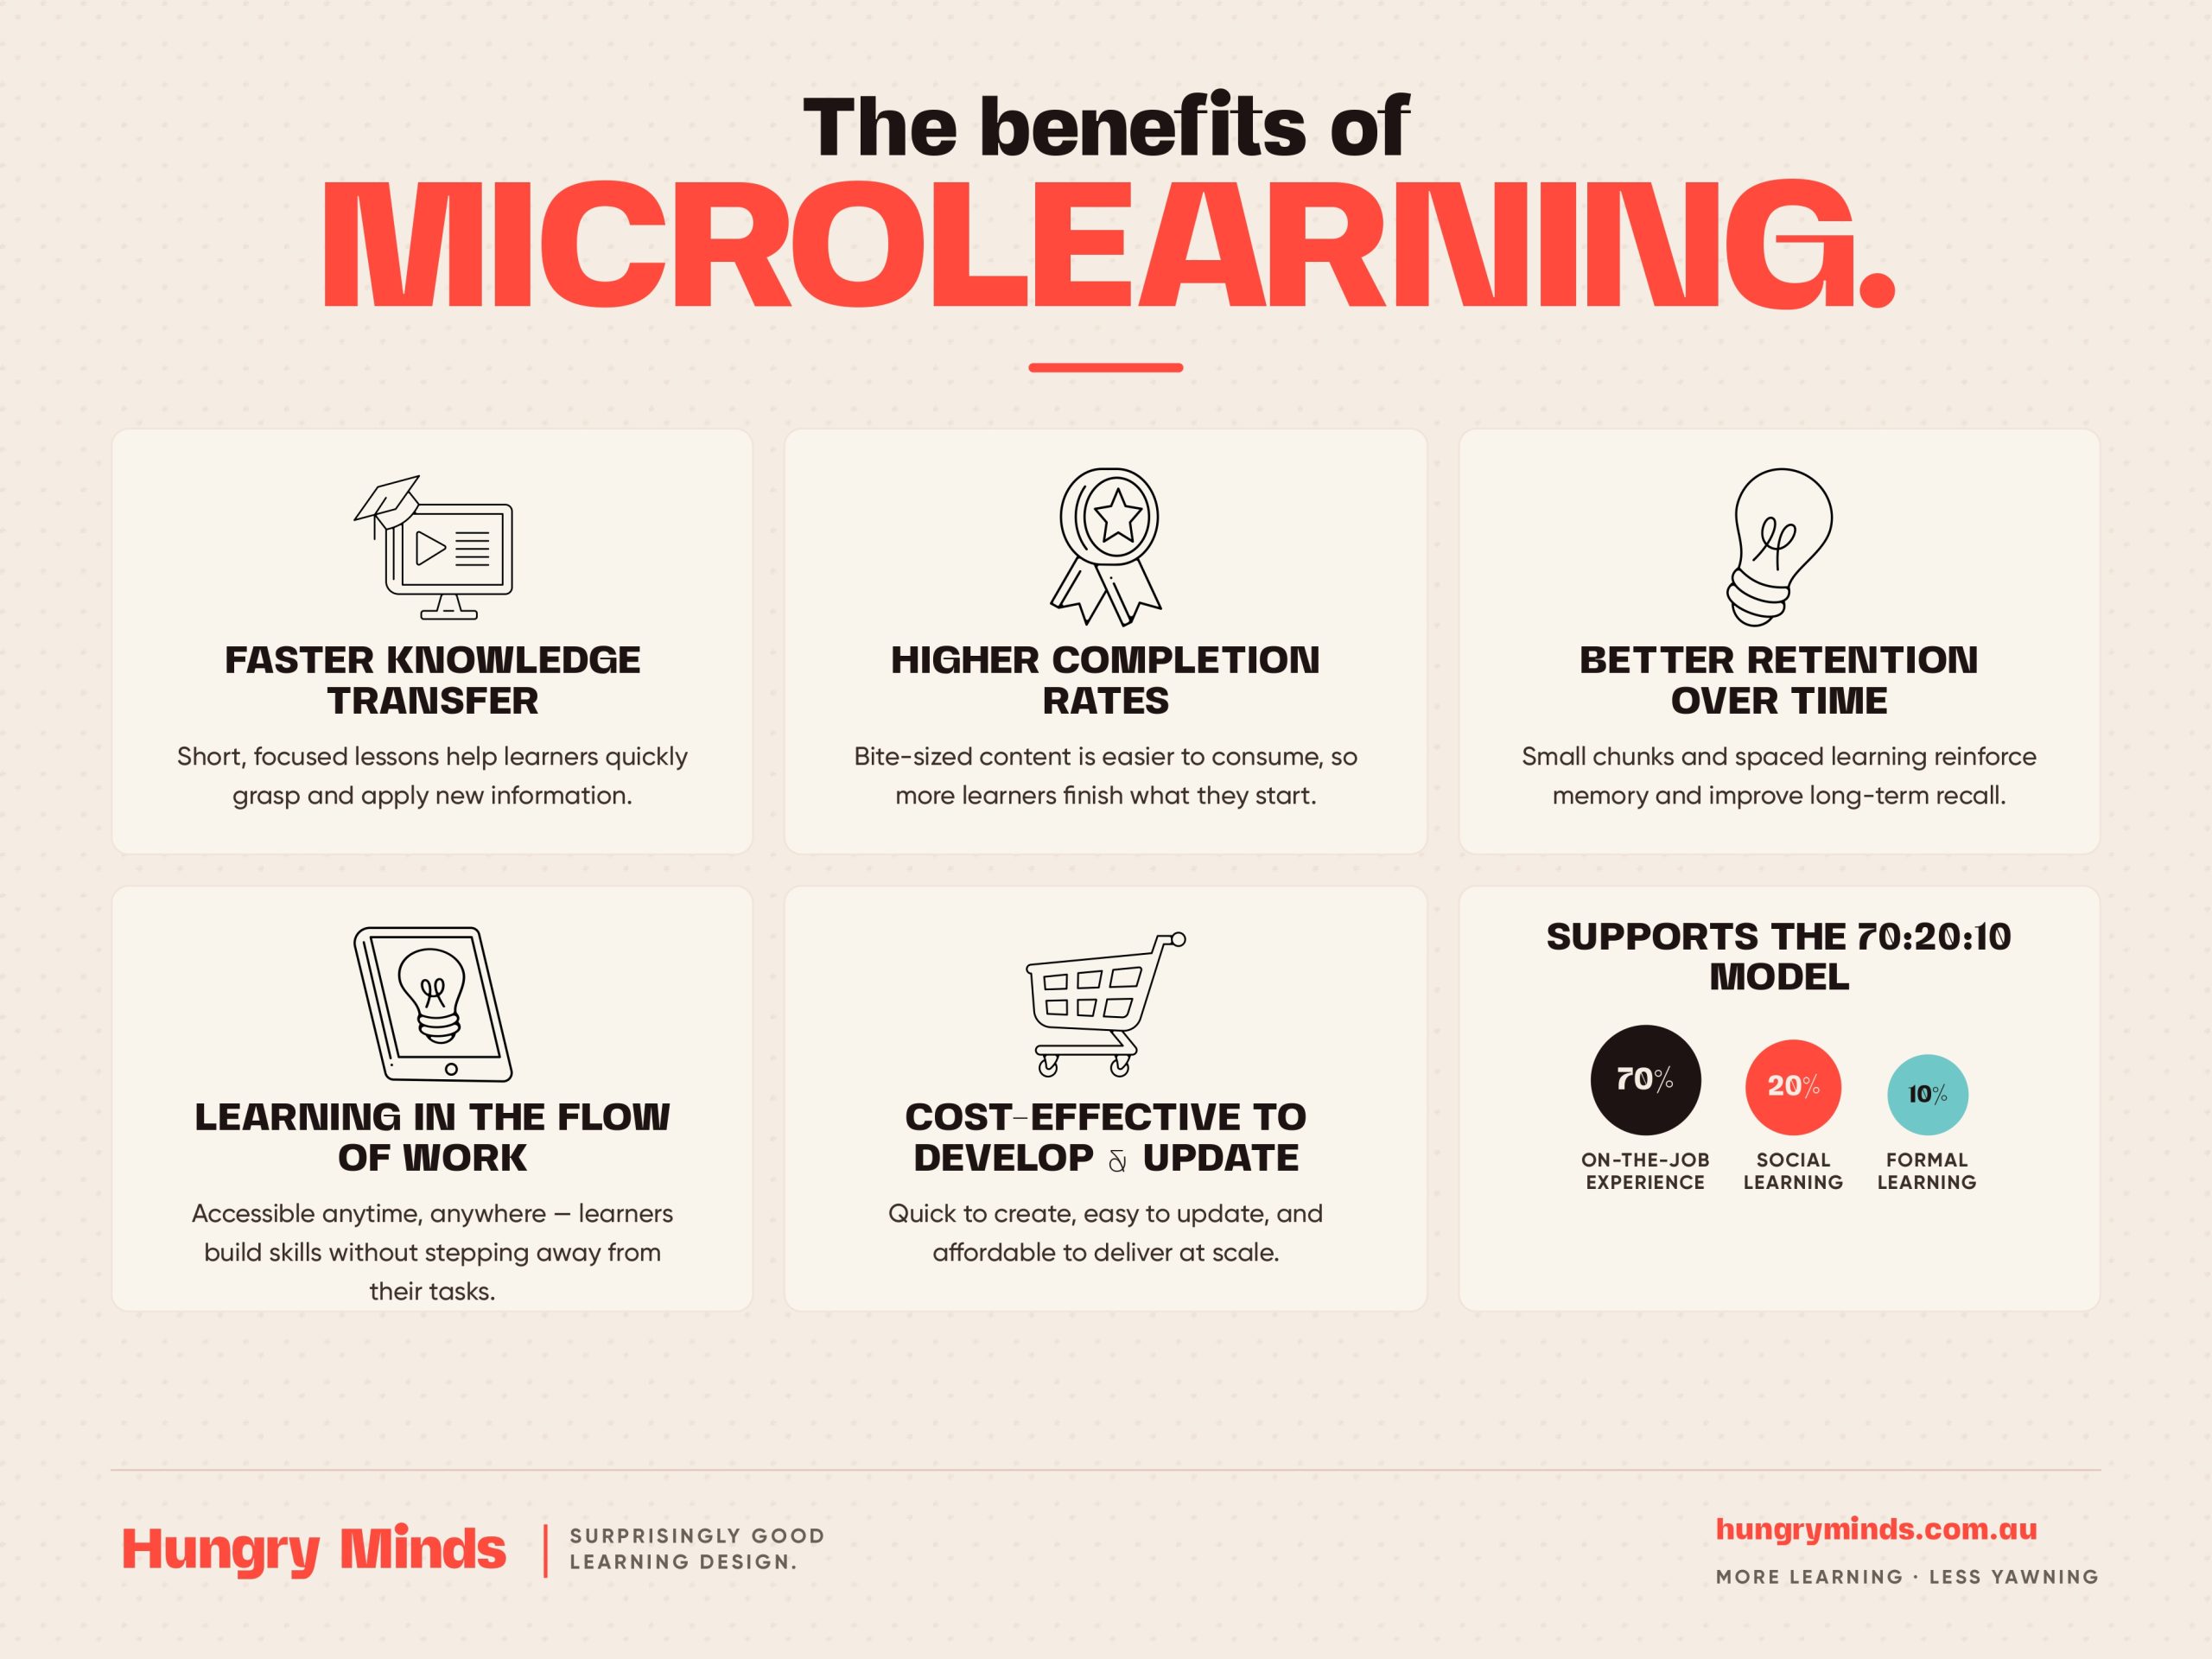
Infographics turn learning from a slog into a sprint. They're particularly brilliant at making complex information digestible, boosting retention, and allowing learners to self-navigate through content at their own pace.
Infographics are learning superheroes because they work with how our brains are actually wired. We process images 60,000 times faster than text. They compress paragraphs of explanation into instant understanding and reduce cognitive overload.
Visual design organises information, creates clear paths for the eye to follow, and establishes what's important. Well-crafted visuals reduce cognitive overload, which means your team's brains aren't wasting energy trying to parse chaotic content.
The fab four: 1. Representational graphics: Show what something looks like. 2. Organisational graphics: Show relationships and hierarchies. 3. Interpretive graphics: Explain how things work. 4. Transformational graphics: Show change over time or steps in a process.
Start with clear learning objectives—what should people know or do after seeing this? Craft a narrative that builds understanding step by step. Test with real learners and iterate based on what actually helps them learn.
Every knockout infographic combines: 1. A compelling headline that hooks attention. 2. A clear visual hierarchy that guides the eye. 3. Data or content that tells a story. 4. Visual design that aids comprehension. 5. A clear takeaway or call to action.
Graphic organisers are structured visual tools that help learners capture, sort, and connect ideas – think mind maps and flow charts. Infographics are more comprehensive visual narratives that combine text, data and design to tell a complete story.
Graphic text refers to visually-enhanced text elements like callouts or stylised headings. Infographics combine text, data, and visuals in a cohesive design to tell a complete story – they're much more comprehensive than enhanced text alone.
CASE STUDIES

Energy Australia
We merged two separate safety modules into one cohesive 30-minute eLearning covering physical and psychosocial hazards. See how Hungry Minds did it for EnergyAustralia.
Read article
FOOD FOR THOUGHT
Energy Australia
We merged two separate safety modules into one cohesive 30-minute eLearning covering physical and psychosocial hazards. See how Hungry Minds did it for EnergyAustralia.
Read article
WHO WE WORKED WITH
LEARNING PICK ‘N MIX
We've got all the ingredients to make your learning program deliciously effective.